- The useful question isn't "which stock is better?" — it's "which one improves the portfolio I already own?" The agent runs fundamental quality and quantitative optimization together and answers the marginal-contribution version.
- Worked example — adding GOOGL vs AAPL to a 70% S&P 500 core: the GOOGL sleeve lifted the blend's Sharpe to 2.54 (from an SPY-only 1.40); the AAPL sleeve reached 1.92.
- GOOGL also led standalone (3-year Sharpe 1.43 vs 0.57), on valuation (27.6× vs 35.6× P/E), margins (37.9% vs 27.2%), quality score (58 vs 42), and even diversification (0.589 vs 0.639 correlation to the S&P 500).
- The verdict — GOOGL — came with the honest tradeoff: the AAPL blend had a shallower drawdown (−9.1% vs −12.4%), so AAPL is defensible if containing drawdowns matters more than raw risk-adjusted return.
- Every figure is a real output from a live run on daily data, using a shrinkage covariance and a capped long-only optimizer. This is a methodology walkthrough, not a stock call.
"Which is the better addition to my portfolio — GOOGL or AAPL?" gets a different answer depending on who you ask. A fundamental analyst points at valuation and margins. A quant points at Sharpe ratios and covariance. Both are half-right — and both miss the question that actually matters, which is not how a stock behaves alone but how it changes the portfolio you already hold.
We asked our agent to integrate all three: fundamental quality, standalone risk and return, and the marginal contribution of each name to a diversified core. Here's the walkthrough, with real numbers from a live run.

What does the agent look at first?
It began with two per-stock lenses.
Fundamental quality. On valuation and business quality, GOOGL is the rare name that is cheaper and higher-margin: a trailing P/E of 27.6× versus AAPL's 35.6× (25.3× vs 30.4× forward), a PEG of 1.41 versus 2.34, a 37.9% profit margin versus 27.2%, and a composite quality score of 58 versus 42. AAPL isn't strictly beaten — it posts a higher return on assets (26.2% vs 14.6%), a reminder that no single stock wins every metric.
Standalone risk and return. Over three years of daily data, GOOGL compounded at 46.7% a year with 29.9% volatility for a Sharpe of 1.43; AAPL returned 19.1% at 26.5% volatility for a Sharpe of 0.57 — roughly a third of GOOGL's. GOOGL's max drawdown was also shallower (−29.8% vs −33.4%).

But does it actually improve a portfolio?
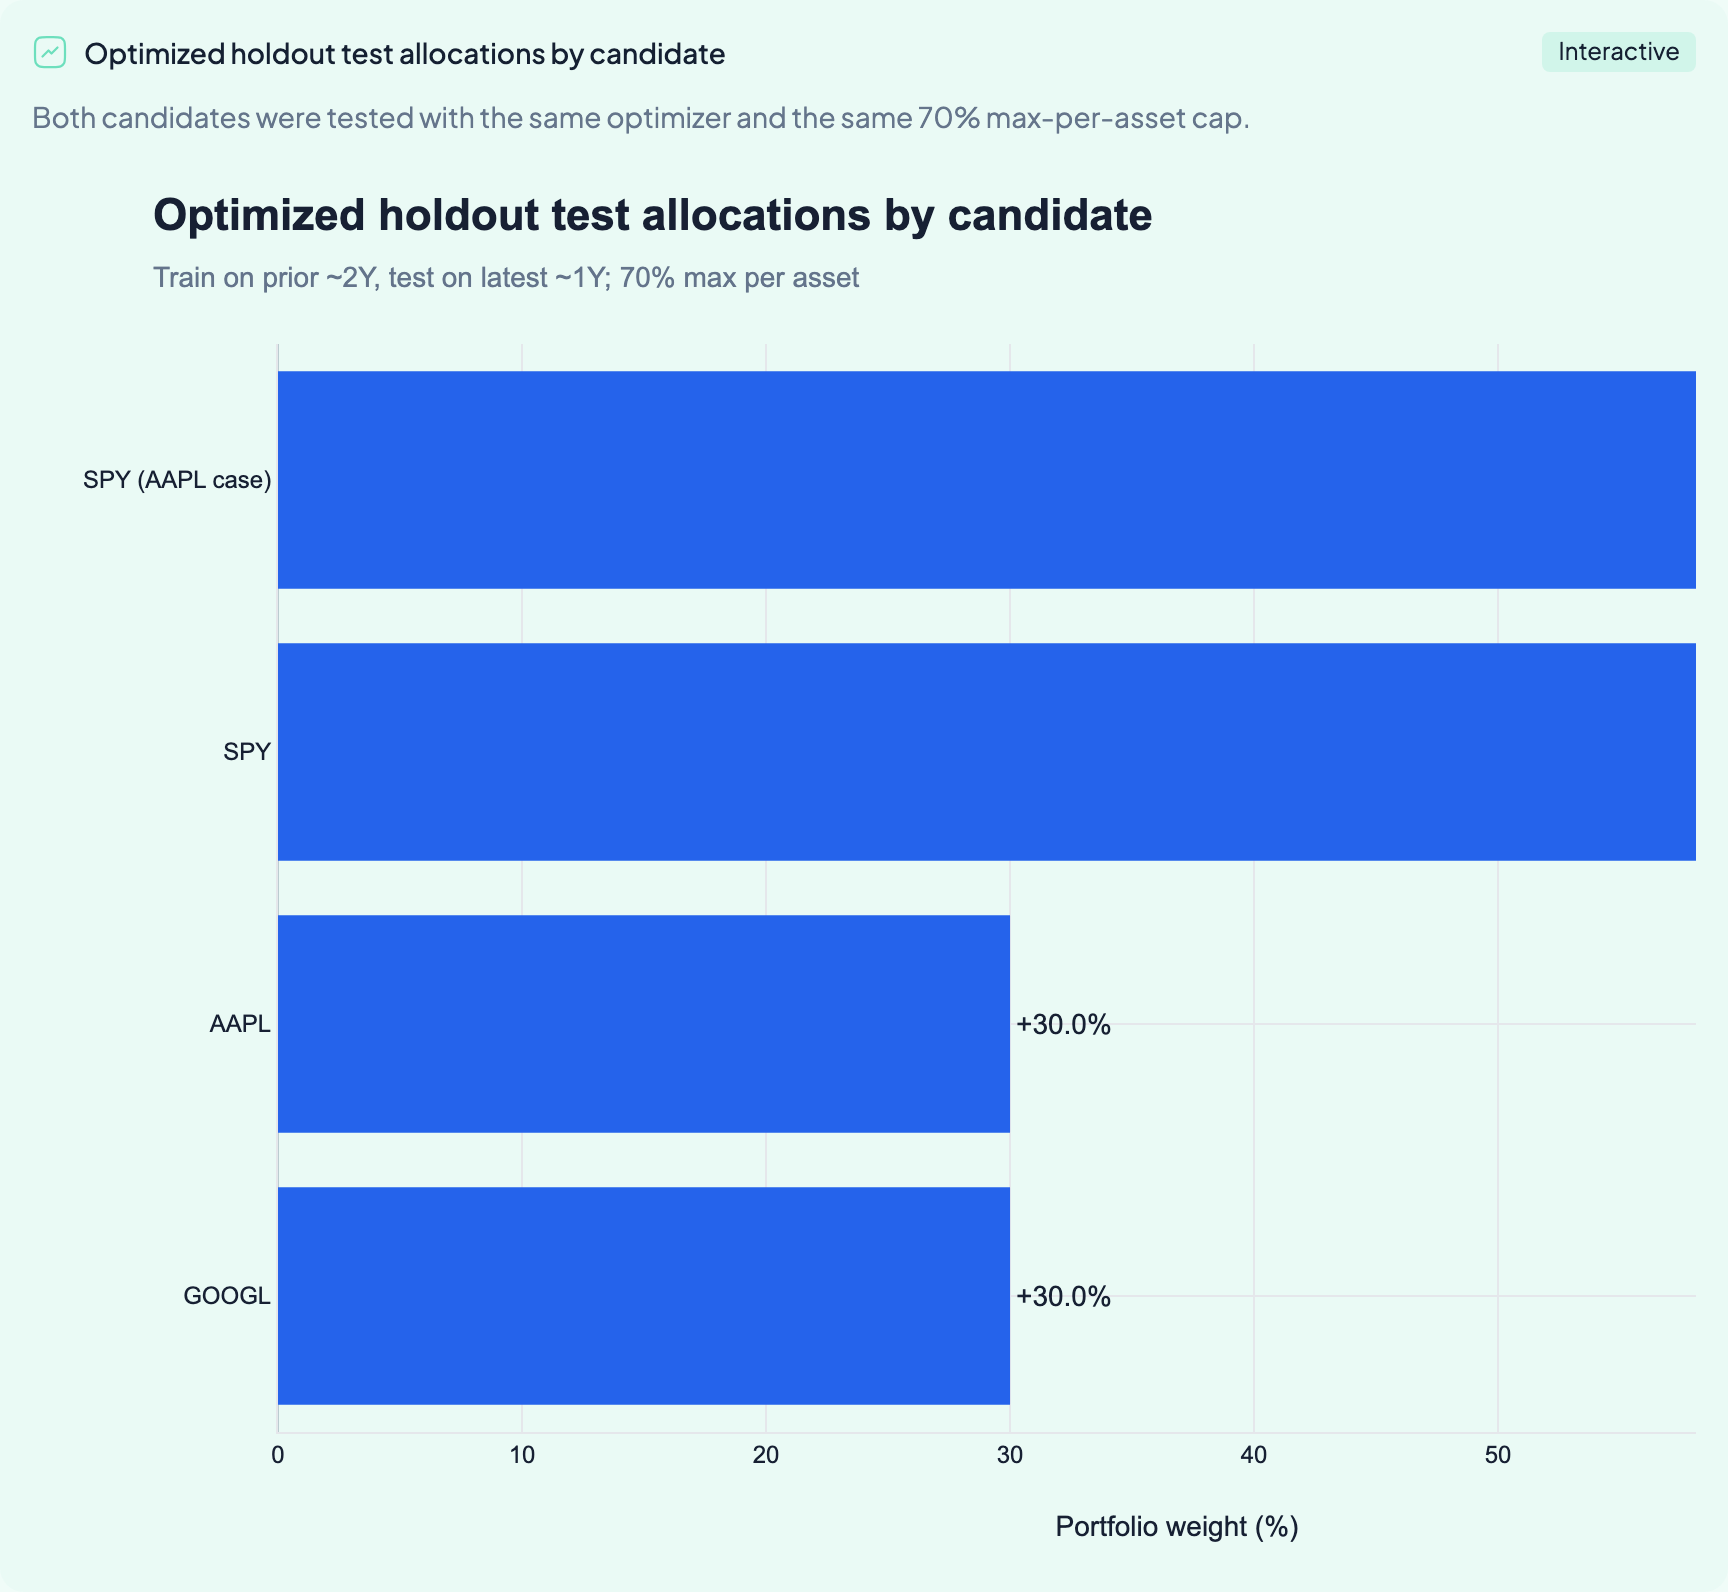
Standalone metrics describe a stock in isolation. The decision that matters is marginal: add it to what you already own, and does the blend get better? The agent estimated a shrinkage covariance and tested each candidate as a 30% sleeve on top of a 70% S&P 500 core (a capped, long-only optimization), against the S&P 500 alone as the baseline.
| Holdout portfolio | Ann. return | Volatility | Sharpe | Max drawdown |
|---|---|---|---|---|
| S&P 500 only (baseline) | 21.6% | 12.6% | 1.40 | −8.9% |
| 70% S&P 500 + 30% GOOGL | 43.9% | 15.7% | 2.54 | −12.4% |
| 70% S&P 500 + 30% AAPL | 30.1% | 13.6% | 1.92 | −9.1% |
Both candidates improved the core, and both hit the 30% cap the optimizer was allowed — but the GOOGL sleeve lifted risk-adjusted return far more (Sharpe 2.54 vs 1.92), and it did so partly because GOOGL is slightly less correlated with the index (0.589 vs 0.639). A fixed 80/20 blend told the same story (GOOGL Sharpe 2.25 vs AAPL 1.80).
The decision
| Metric | GOOGL | AAPL |
|---|---|---|
| Standalone Sharpe (3Y) | 1.43 | 0.57 |
| Annualized return | 46.7% | 19.1% |
| Max drawdown | −29.8% | −33.4% |
| Trailing P/E | 27.6× | 35.6× |
| PEG | 1.41 | 2.34 |
| Profit margin | 37.9% | 27.2% |
| Quality score | 58 | 42 |
| Correlation to S&P 500 | 0.589 | 0.639 |
| Sharpe added to 70% S&P 500 core | 2.54 | 1.92 |
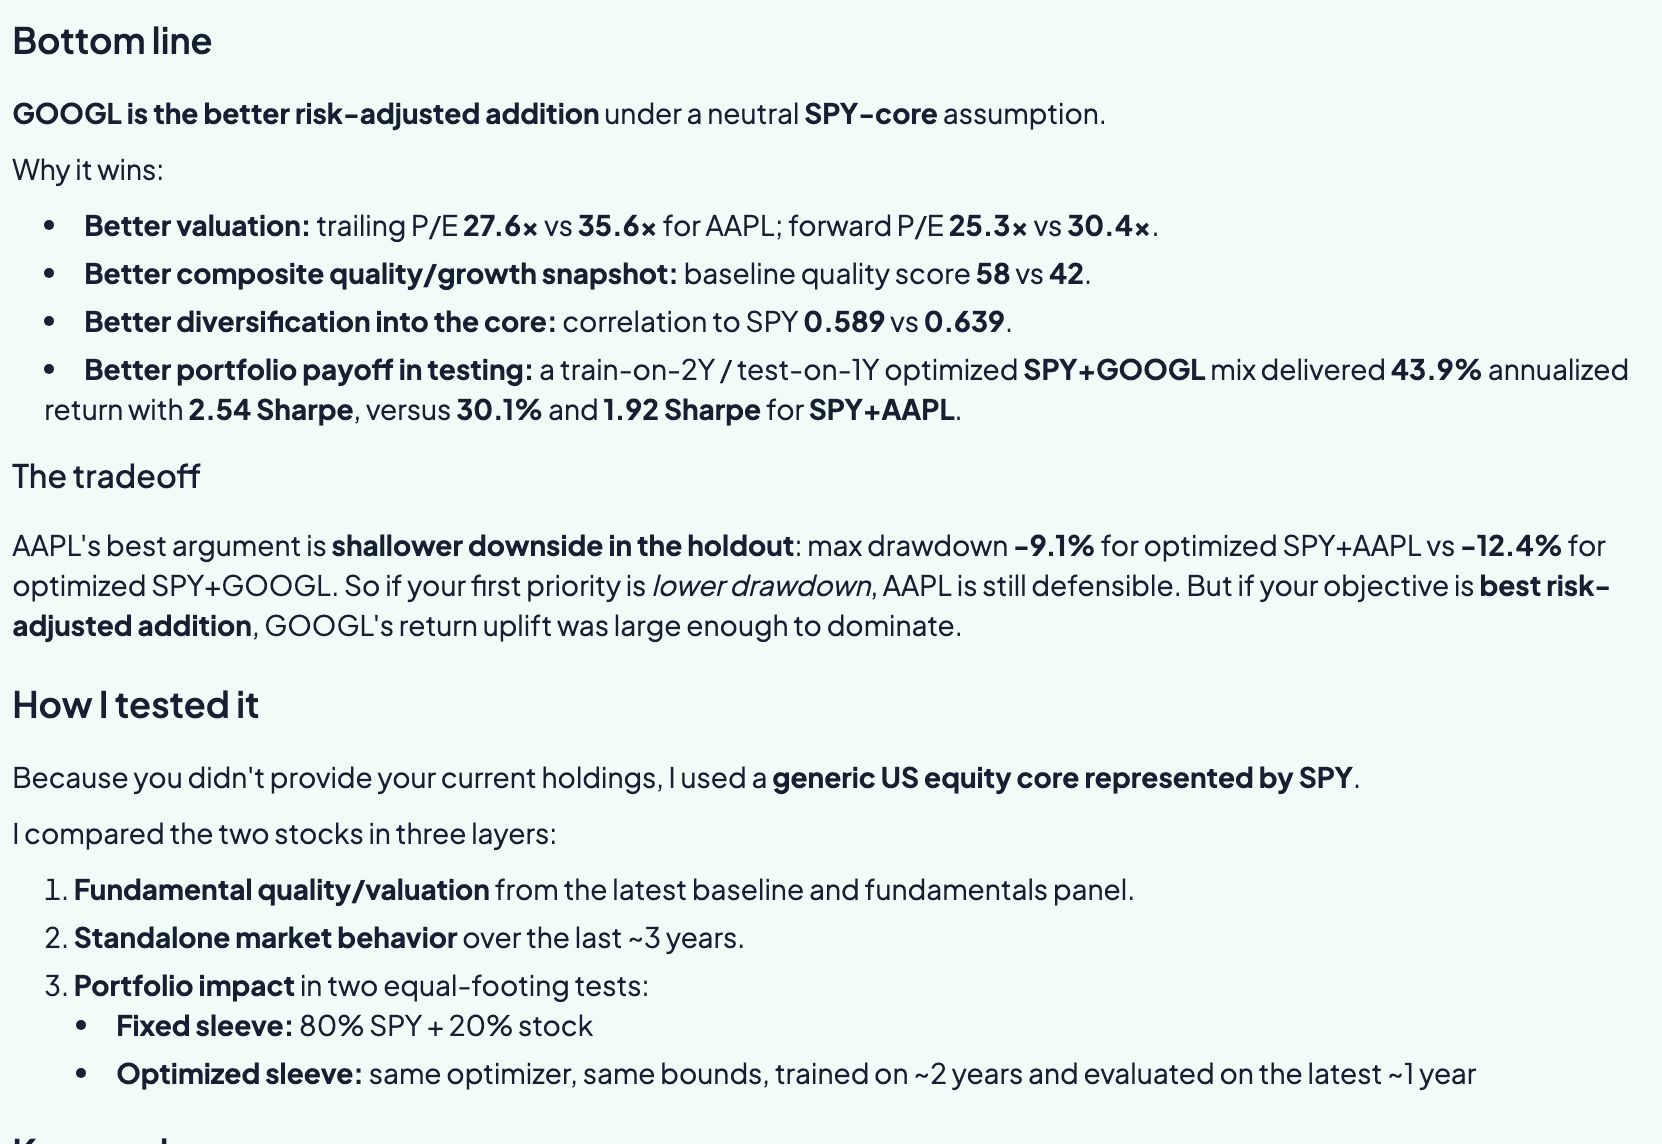
"If you want the better risk-adjusted addition to a generic US equity portfolio, choose GOOGL."
The tradeoff it volunteered
The agent didn't stop at the verdict — it named where the clean story gets complicated:
- AAPL is defensible on drawdown. The AAPL blend's worst peak-to-trough loss was shallower (−9.1% vs −12.4%). If containing drawdowns matters more to you than maximizing risk-adjusted return, AAPL is the more conservative add.
- No clean sweep. AAPL still leads on return-on-assets, so "GOOGL wins" is a judgment on the weight of the evidence, not a shutout.
- The core is a stand-in. We tested against an S&P 500 core as a proxy for a diversified US-equity portfolio. The truly personalized version swaps in your actual holdings and asks the same marginal-contribution question — which is the natural next step.
What this doesn't show
- This is a two-candidate comparison against a market-index core, not a full portfolio optimization over your real holdings or a broad screen.
- The risk numbers use daily data over a few years and a single shrinkage covariance. A full factor model (see How We Built a Global, Cross-Asset Factor Risk Model) would attribute the risk more precisely than one correlation number.
- Fundamentals are point-in-time; valuations and quality scores move.
- These are research and backtested figures on held-out history — not live-traded performance, and — as ever — the agent is built to tell you when the evidence isn't there.
For research and informational purposes only; not investment advice. All figures are from a research run on historical data, not live trading, and past performance does not guarantee future results.